| The Solar Clock, or Grey Line Map, shows the band around the earth that separates daylight from darkness. It is useful in radio propagation because you can see where daylight and darkness are, which is useful for selecting bands or frequencies for transmission to that region. Also, propagation along the "Grey line" is very efficient. Also see the DX.QSL.NET Gray Line Map for more details and an automatically refreshing map. |  |
| Image courtesy of Tim Osborn at the Climatic Research Unit | |
|
This Maximum Usable Frequency (MUF) map shows the the near-real-time MUF for 3000 km propogation paths. For detailed information on how to use it, see the Solar Terrestrial Dispatch MUF Map page |
 |
| Image courtesy of Solar Terrestrial Dispatch | |
|
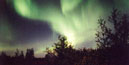
This near-real-time image of north pole auroral data derived from recent measurements of energy deposition into the auroral oval by the NOAA/TIROS spacecraft. The red level depicts high power flux. See the NOAA Space Environment Center for more. |
 |
| Image courtesy of the NOAA Auroral Activity Site | |
| The highest (see note) frequency which the ionosphere will reflect vertically is called foF2. These foF2 measurements from various sites can be used to create a map of foF2. The data used to produce the map of the USA region are from USAF observing sites and obtained from Space Environment Centre, Boulder Colorado. |  |
| Image courtesy of the Australian Space Weather Agency | |
| The
HAP chart is a guide to frequency selection for HF communications between
mobiles and a specified base station, in this case New York. The recommended
frequency for communications with the base at a given hour is read off
from the point in the map corresponding to the mobile's location.The predictions
are made from real time data which are updated each hour.
'dash lines' - If present,
these delineate areas of unlikely communication. Poor communication
areas which can result from one or more of the following conditions: |
 |
| Image courtesy of the Australian Space Weather Agency | |